
Rocket Experiment for Neutral Upwelling 2NASA Mission 52.002 - Mission OverviewMarc Lessard, UNHUpdated: 12 April 2016This page is intended to be a repository to summarize the RENU2 mission, including information about the launch conditions, trajectory, data and instrumentation (including both ground and onboard instruments). At this point, the information contained in this document is considered proprietary. 1 Launch OverviewLaunch took place on Dec 13, 2015 at 0734 UT. Conditions leading up to launch consisted of the development of a series of PMAFs. These were observed without a strong sign of cusp aurora, presumably because the positive By kept the cusp further to the east of us and the PMAFs were propagating to the northwest, which is consistent with what we were seeing. Magnetic noon occurs at approximately 0900 UT, so this seems to make sense. During the minutes before launch, CUTLASS SuperDARN Radar signatures were intermittent but seemed to show hints of us being in the cusp, with stronger cusp-like signatures a bit to the east of us. Not long after launch, these signatures became quite a bit stronger. During the fourth stage, the payload took a right turn and so went 2.8 sigma to the right. This, it turns out, was very good for us. The planned trajectory would have been fine, but the drift to the east 1) brought us over brighter 630 nm emissions and 2) meant that the payload cut through the arc obliquely as it dropped in altitude, providing LOTS of interesting data. The unexpected trajectory did result in an apogee of only 447 km, as opposed to the planned 500 km. Remember, the idea was that apogee occurs to the south of EISCAT, so the plan was to descend as parrallel to the EISCAT magnetic field as possible. The payload reached apogee at T+409 which was very close to nominal so it does seem like we descended down along the arc in some sense (or maybe along a set of adjoining arcs). Preliminary quick-looks show electron precipitation beginning near T+442 and lasting until T+655 (200+ seconds of data within an arc!?). It may be the case that we hit re-entry while still inside the arc. Finally, there is also an electron heating event around T+335 to T+370, though with no obvious precipitation at that time. We have excellent allsky camera data, EISCAT and Cutlass data, in addition to other ground instruments from KHO. This includes a movie from Fred Sigernes at UNIS: In the video above you can see the Poleward Moving Auroral Forms (PMAFs) moving overhead at KHO at approximately 1 km/s. They are very transient and finely structured. 2 Payload InstrumentationHere are the descriptions of the various instruments (grabbed from the proposal, so maybe not quite "as flown"). This is included here for general information, but descriptions of instrument problems will be added as we move forward. All instruments seemed to have worked as intended, though the onboard imager was swamped by sunlight. 
3 Trajectory
The figure above shows the actual payload trajectory. The near-vertical dotted lines are IGRF magnetic field lines; the gold line is the sunlight terminator, calculated step-by-step throughout the flight. The payload reached sunlight at T+88 and returned to darkness near T+650. The location in the PMAF is based on the in-situ electron data (and confirmed by the all-sky camera data). All of these numbers are quite close to planned trajectory, except that the eastward drift of the payload placed it approximately 158 km from the EISCAT beam, at its closest approach which occurred near T+482.5.
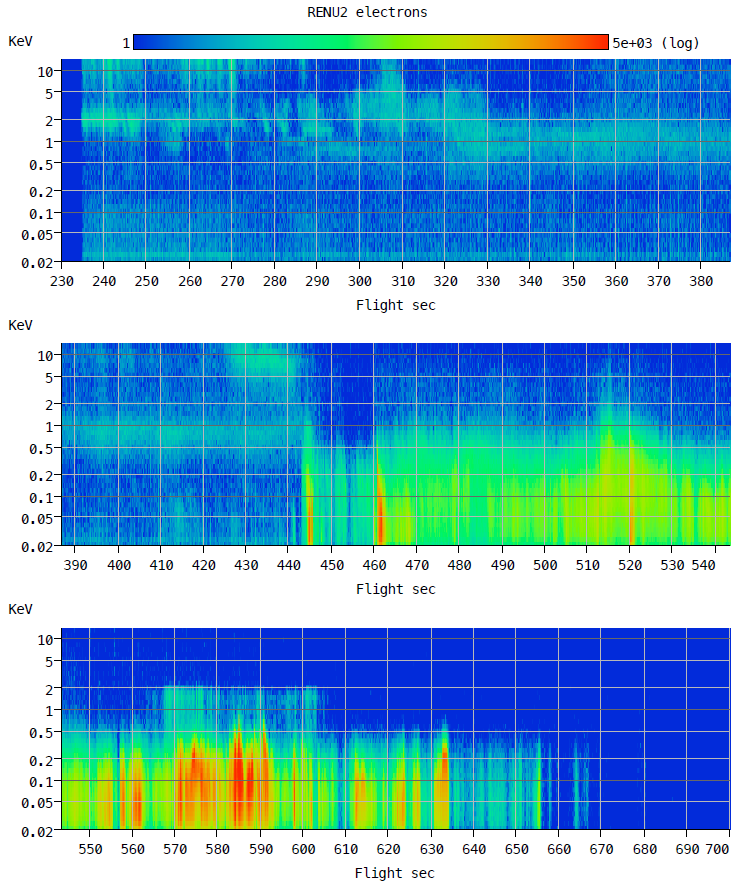
The image above is from the U. of Oslo allsky camera in Longyearbyen, with the track of the payload superimposed. The track shown is the expected trajectory, but just by mapping laittiudes and longitudes (no magnetic mapping in this case). See Section 5 for more information regarding allsky data and the payload trajectory. 4 Moving Forward...The figure below shows electron precipitation from the EPLAS instrument. Time after launch is on the horizontal axis, energies are plotted along the vertical axis and color represents fluxes (counts). The plot shows a good summary of the flight, except that EPLAS missed the heating event at around T+335 to T+370. This plot is now from the Svalsat TM and contains the entire flight. In addition to the additional data, this plot also includes time stamp and dead-time corrections. IMPORTANT: we are taking the launch time to be 7:34:00.000 UT and are using the data from the Svalsat TM for consistency.
In any case, it's easy to see that we caught a beautiful event, dropping down the field line as planned. The time of interest starts near T+442, lasting until T+655. In order to make good progress on the data analysis, we plan to do a few things.
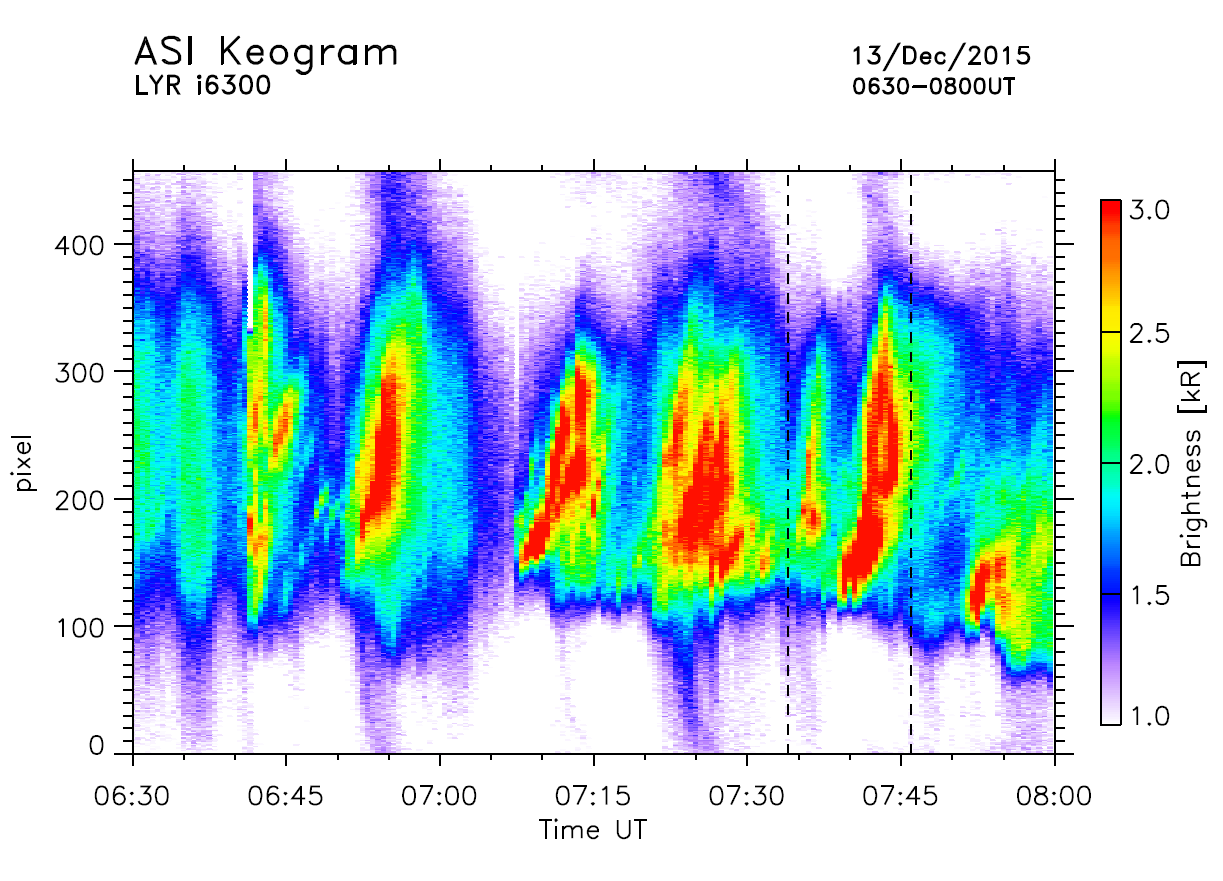
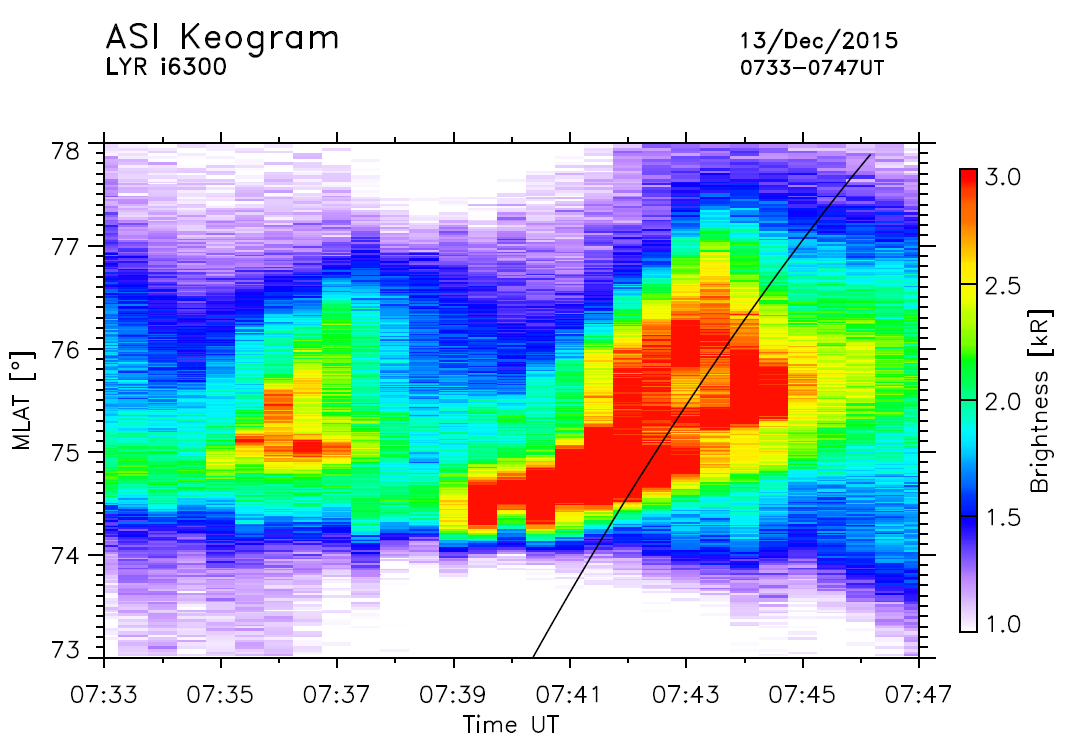
5 Optical observationsLasse Clausen has provided detailed (and calibrated) plots of allsky camera data. Figure 4 shows keograms extracted from the 630 nm allsky camera. The panel on the left includes data from an hour before launch to show the development of PMAFs and temporal aspects of auroral heating. Note that there was snow on the camera dome, initially. The KHO crew scrambled to clear the dome as things developed and data before about 06:42 are not reliable. The panel on the right shows details of the PMAf transited by the payload.
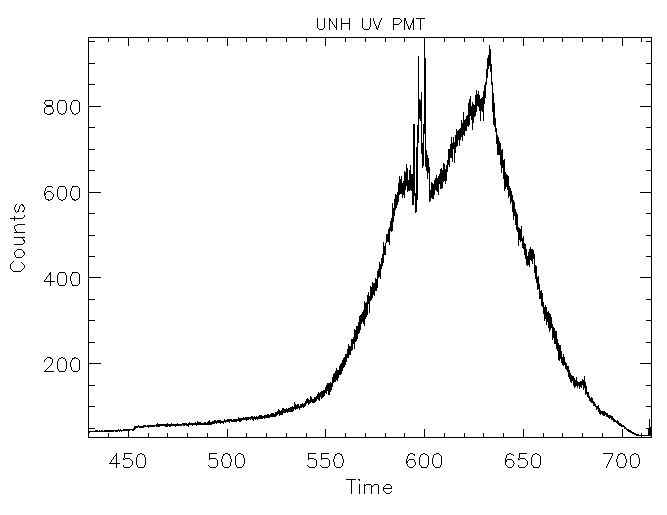
From Lasse: "Our imager has a resolution of 20-30 seconds; I can prepare plots of all the images we have during the flight. Note that these images are already available at http://tid.uio.no/plasma/aurora (click your way to the right date, and chose the appropriate hour of the Longyearbyen keogram - below it is a link "show individual images" which does just that). However, these images are individually scaled so it is diffcult to compare between them - like I said, I will prepare all images on a common scale for you. You can also download the PNGs from the website and do your own analysis (click "open raw image folder" instead of "show individual images")." 5.1 DMSP SSUSI dataBruce has been following up on a suggestion from Kjellmar to look at DMSP UV data. There are excellent data available from the UV imagers on F16 , F17 and F18. The imagers use a "pushbroom" technique, so we get one image per orbit (altitudes are near 830 km). The imaged wavelengths include 130.4 nm (nominally from solar UV fluorescence) and 135.6 nm (nominally from electron bombardment), both from neutral atomic oxygen. The onboard UNH UV PMT instrument used a narrow bandpass filter that included both of these lines. The onboard PMT was aimed UP the field line.
The figure above shows an image from F18 that corresponds (we think) to the RENU2 over flight. This is just an initial effort, but you can easily see Greenland, as well as a faint white spot (Svalbard) with atomic oxygen roughly in the same vicinity as the PMAF. On the right side of that figure is the data from the UNH PMT, where you can see these same emission lines as the payload passed over the PMAF. There is still a lot of work still to do with these data, but it seems clear that the satellite observed atomic (neutral) oxygen below the spacecraft, while RENU2 saw similar emissions as it looked UPWARDS, so observed atomic oxygen ABOVE the rocket payload. Obviously, it will be important to compare the relative brightnesses of these observations in order to estimate the density but it looks like we have a very good measurement of upwelling atomic oxygen. 6 Updated, early March 2016Recent additions include 1) Cutlass and EISCAT radar plots, 2) in-situ electric fields, 3) Aerospace PMT data. 6.1 Radar dataTim Y has provided plots of Cutlass radar, providing solid evidence that we were in the cusp during launch and also providing quantitative information about convection. The left half of the figure below shows an overview. More details are provide on our RENU2 website, but the bottom line shows poleward convection (yellow pixels), typical of the cusp. Tim will also add the RENU2 trajectory to these plots.
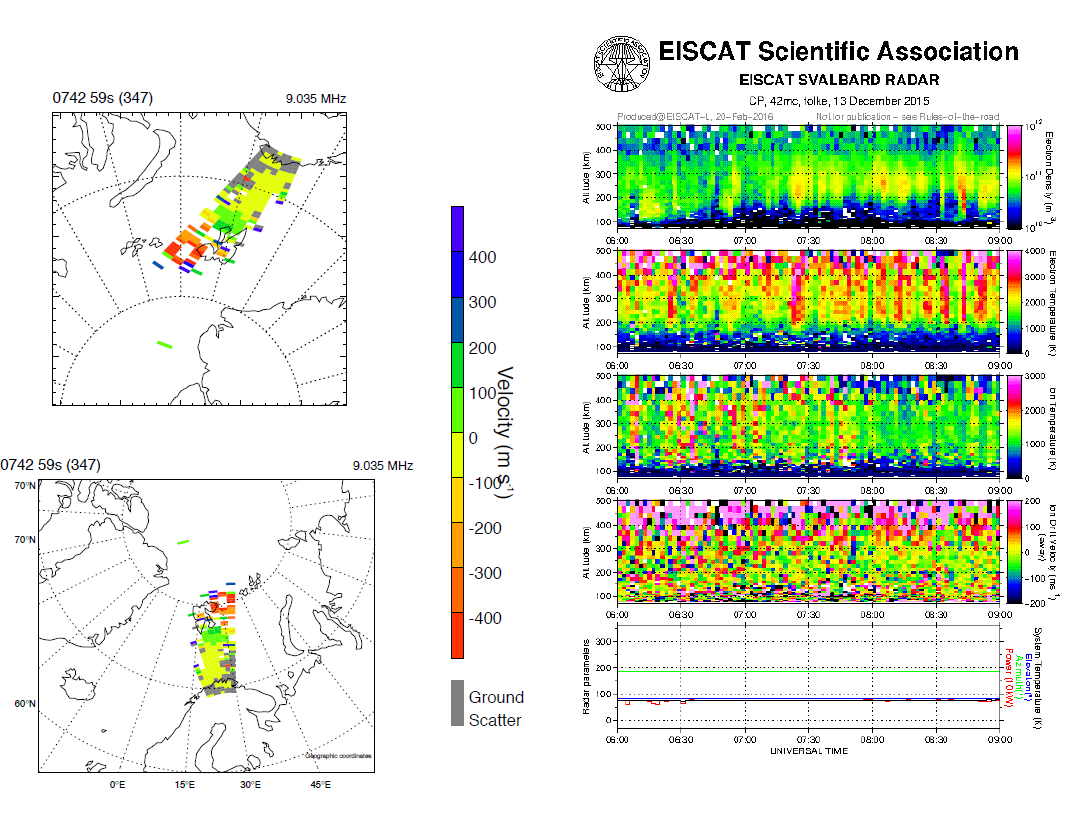
Kjellmar has provided an improved plot of EISCAT radar. From his email, "I have reanalyzed the EISCAT data with different resolution, and I found that 120 seconds integration gave the best temporal resolution vs. signal-to-noise." In the right side of the figure above you see:
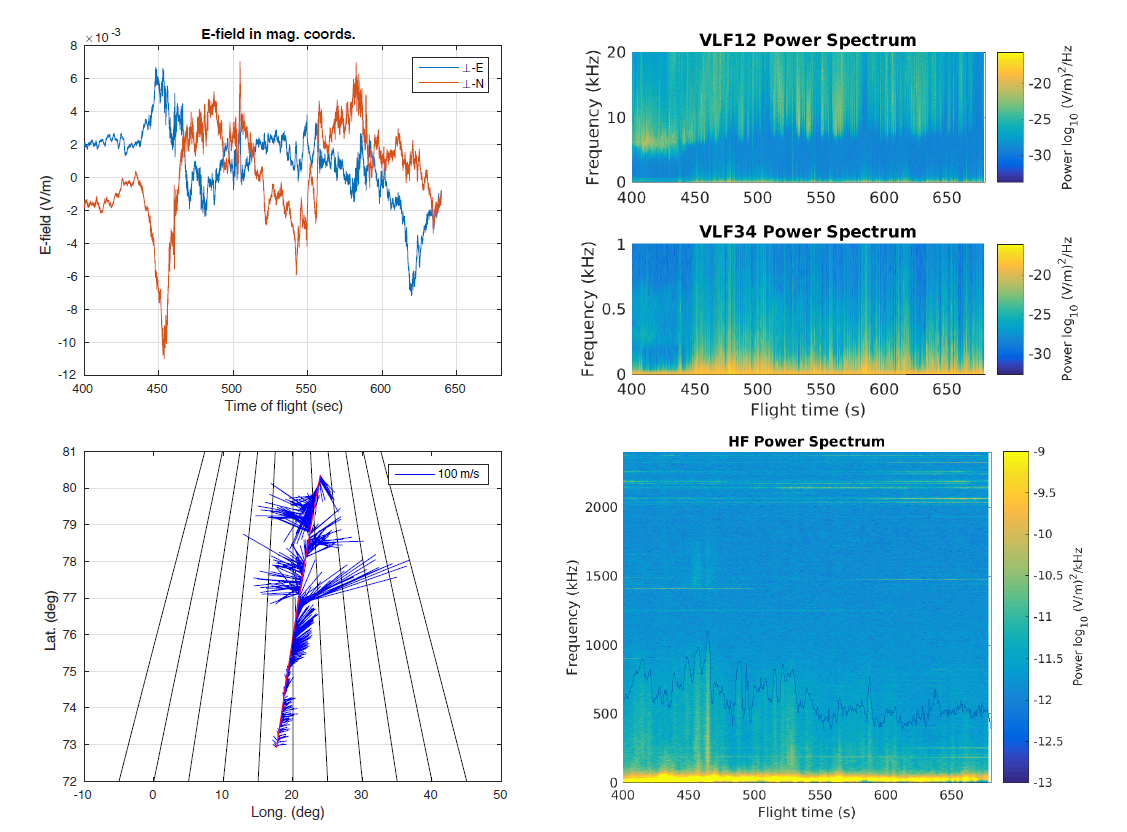
6.2 In-situ electric field dataDave has processed onboard electric field data, shown in the figure below. Note that these plots have time stamps from T+400 to T+680, which seems to work well because it shows a good overview of the flight with adequate detail at this point. The upper left plot shows DC fields, the upper right shows VLF wave power. The bottom left is a feather plot, showing convection, which is not very strong, which is good in the sense that it is not anomolous, and seems to show numerous counterstreaming flow channels (typical for the cusp, as I understand it). The bottom right plot shows the plasma line, which will be converted to densities.
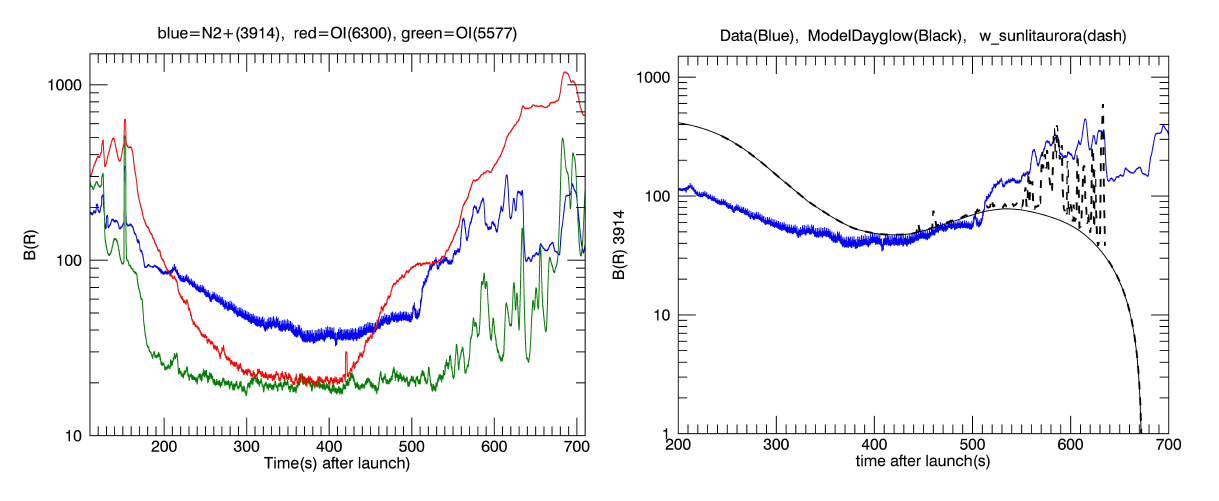
6.3 Aerospace PMT data (N2+)Jim H has a very interesting result, from the Aerospace PMT's, looking upward, above the payload. The figure below shows a photometer overview plot on the left. From Jim: "I have not corrected for sunlight entering the 3 channels. I believe that averages out to about 10 to 20 R. I also have not corrected for the filter transmission of the 3914 band (about 60 percent). The most noteworthy aspect is that the 3914 channel shows a sharp increase in signal around 500 s and a sharp decrease around 630 s. These sharp changes are not seen in the other two channels." The plot on the right focusses on the 3914 channel. "The analysis is still preliminary. However, we can say a few things. Almost all of the 3914 signal is due to solar scattering off N2+ ions. In fact the 3914 signal shown is 0.05 times the N2+ column above the rocket which is illuminated. I have worked with CPI to do a first cut at the 3914 day glow. That is the solid line. It over estimates on the up leg and underestimates on the down leg. This could perhaps be related to different N2/O ratios. I also added in the extra signal due to the production of additional N2+ ions from the auroral precipitation. Noteworthy is that there is no sudden jump at 500 s. Is this due to a sudden change in composition or ion upwelling? Unknown at this time. We are also looking as to whether the day glow really decrease so rapidly on the downleg."
To put things in perspective, N2+ ions have been associated with what is called "sunlit aurora". This is "aurora" in the sense that it has been ionized by electron precipitation, but the luminosity comes from solar UV photons { or that it the idea, anyway. There have been reports of N2+ at altiudes up to 800 to 1000 km, so it seems that it must be driven upwards as part of the ion upflow process. Although number fluxes are something like 10% (from an older Yau paper using Akabono data), the mass flux would presumably be 20% so is significant. It seems to me that this is an excellent result! Jim pointed out another paper on this, but it seems like the RENU2 observations are special in that they are unique in relating the sunlit aurora to ion upflow. 6.4 Modeling efforts and next steps...As we move ahead, it will be important to keep in mind that there are significant modeling efforts that will be needed to explain the physics. When it comes to explaining the neutral upwelling, I would say that there are now 4 different (VERY different) theories. Below is a one-line description of each, along with individuals who could run the model(s)
In anticipation of what we will need for the modelers, I am asking the U. Oslo folks to extract luminosity at the footprint at T+600 versus time, going back to maybe an hour before T+600. The idea is that heating the neutrals takes a lot of time. In a PMAF event, the heat from electron precipitation is deposited as the arcs pass overhead. This means we would expect to "see" (from the models) the electron temperature heating and then cooling within 10-20 seconds or so, relative to the PMAF arcs. We should see the ion heating tend to average out more, because of its greater thermal mass and we should see the neutrals require the longest (integrated) heating times. But the neutrals have the greatest thermal mass, so the effect should be more smeared than for the ions. Comments on this idea are very welcome! 7 Updated, early April 2016Recent updates include:
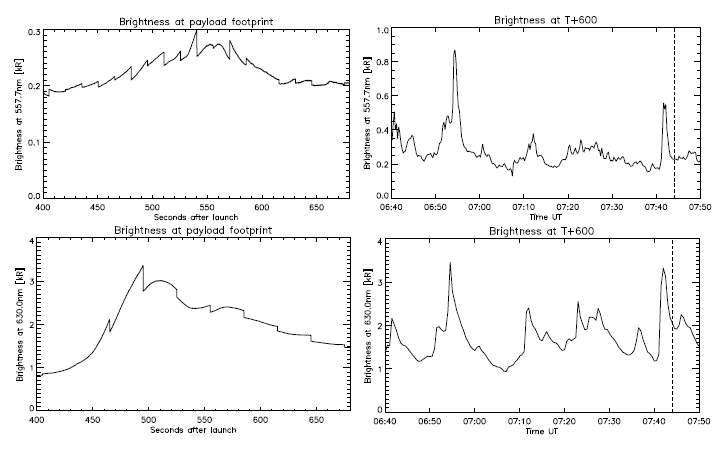
The figure above shows plots that Lasse provided, derived from the U. Oslo (J. Moen) allsky camera data. The two panels on the left show the brightness at the payload footpoint throughout the flight, with 557.7 nm in the top panel (mapped to the 150 km footpoint) and 630.0 nm in the lower panel (mapped to the 250 km footpoint). The steppiness in these plots results from the integration times of the cameras, which is 15 seconds for 557.7 nm and 30 seconds for 630.0. These plots can generally be expected to show good correlations with variations onboard the payload having short timescales. The plots on the right hand side in that figure are intended to show the temporal effects of the precipitation as the arcs drift poleward through a point that maps to the payload at T+600 seconds, which is when we seem to see heated neutrals (according to the UV PMT data). Convection speeds were ~100-200 m/s so should not be ignored but I think they may be relatively insignificant. The way these plots were done was to first identify the region in the allsky camera where the payload mapped to at T+600 seconds. Then, data were extracted (using a 20 km radius) from that region extending back to 06:40 UT with the idea that the plot should provide a measure of the temporal variations of the precipitation over that spot. The same altitudes were used as above and all mapping was done using IGRF. The approach that I have in mind would be for the models to turn precipitation on and off in such as way as to emulate these variations. Then, we should have good comparisons at T+600 (which is marked on the plot at 07:44 UT) for electron, ion and neutral temperatures. The data files are also posted on the RENU2 website as IDL save files containing, again for the 630.0 nm channel and the 557.7 nm channel, the brightness at the payload footprint (variable named foot bright with seconds after launch in foot secs or Julian day in foot juls - use IDL's JULDAY and CALDAT to convert to day, month, year, etc) and the brightness at the payload location at T+600 in t600 bright together with the Julian day in t600 juls. Use as:
|
||||||||||||||||||||||||||||||||||||||||||||||||||||||||||||||||||||||||||||||||||||||||||||||||||